Google Analytics is a tool that measures traffic and behavior to a website. There are four main groupings of data within the analytics dashboard:
- Audience: Who is coming to your site? Where are they located geographically and what systems tools, operating systems are they using when they visit your site
- Acquisition: how did you acquire the audience? Did they perform a generic search? Did they click on a link on another website, including social media sites? Did they click on a PPC ad or through some other marketing campaig.
- Behavior: Once they were on your site, what did they do? What pages did they visit? How long did they stay on each page? What did they look for on your site? What page did they start on? What page did they leave from?
- Conversions: While they were on your site, what actions did they take that you wanted them to do? What did they accomplish? Did they stay on your site for 5 minutes? Did they submit a contact form? Did they visit your store? Did they read testimonials? Did they sign-up for an email campaign?
Each of these sections have more options and data available within them and we can dig into those further as needed. One to mention specifically for awareness is under Acquisition, within this, traffic is usually grouped into one of the following categories:
- Direct: visitor typed the website URL into the browser themselves, clicked on a favorite/bookmark they have already saved or the specific referral information could not be identified and is grouped under this category.
- Organic Search: visitor searched for a specific term or phrase on a search engine and clicked on a link to the site as a result of their search
- Referral: visitor clicked on a link found on another website or within an email that ISN'T classified as a social site
- Social: a visitor came from a specific identified social media website like Facebook, Twitter, Instagram, etc.
- (Other): usually refers to traffic obtained from other sources through some kind of paid advertising campaign
A Quick Review of the Main Analytics Page
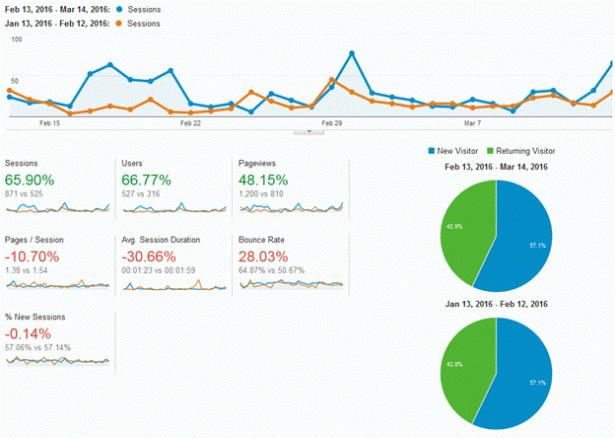
The graph above compares traffic data from the last 30 days (blue line) to the 30 days previous to that (orange line). This is generally used to display growth patterns on a website month over month. In the groupings above, the key data points are explained as follows:
- Sessions: the number of visits to any page on the site
- Users: the number of individual users to the site
- Pageviews: the number of individual pages viewed by all users
- Pages/Session: the average number of pages viewed per visit
- Avg Session Duration: how much time was spent on the site on average during each visit
- Bounce Rate: how many sessions consisted of only 1 page being viewed on the site and then exiting
- % New Sessions: how many visits were from visitors that have not visited the site before (Note: this number can be a generality based on a number of page factors and user behavior changes)
Example Scenario 1:
A potential customer ("User") visits your site four times in one week ("Sessions"). They spent about 10 minutes ("Avg. Session Duration") visiting 20 different pages ("Pageviews") averaging 5 pages per visit ("Pages / Session"). On their first visit they immediately left the site and didn't view any other pages ("100% Bounce Rate"), but after coming back 3 other times to visit the other 20 pages the bounce rate adjusted to 25%.
What Numbers Do I Pay Attention To
With all these numbers being collected for you automatically, sometimes it can be hard to determine which numbers are more important than others. In the total marketing effort they all have importance and can direct actions that need to be taken on a variety of levels. But depending on the client, campaign or goal of the website some may be more important than others.
Having thousands of visitors ("Users") coming regularly ("Sessions") to your site can be a good thing. But if they don't actuall "Do" what you want them to do, like sign-up for your email newsletter, purchase a product, fill out a contact form, then all of those visitors and sessions really didn't do much for you.
Your goal is to attract an engaged and qualified visitor to your site that's going to come and do exactly what you need them to do to get in your funnel and hopefully convert into a customer or supporter for your effort. Therefore the ultimate measurement factor within Google Analytics are measured by "Events" or "Goals"
Google Analytics Events: Just about any click on a website can be tracked as an event (link, button, image, video, etc.)
- They clicked on a specific navigation menu item
- They clicked a button in the sidebar to be taken to another page
- Did they download a file
- Did they play a video
- Did they leave a comment
Google Analytics Goals: goals are similar to events and in fact can incorporate an event action as part of the goal
- Destination: the user visited a specific page on the site
- Duration: the user remained on a page or site for a specific length of time
- Pages/Screens Per Session: an individual user clicked a set number of pages in a single visit
- Event: the user competed a defined event

